| Input or value | Meaning | Units |
|---|
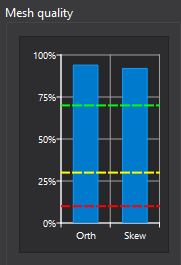
| Ortho | Orthogonality quality based on each cell's worst internal-face non-orthogonality. A score of 1 is orthogonal; 0 corresponds to an angle of 65° or higher. | Dimensionless score, 0–1 |
| Skew | Skewness quality based on each cell's worst face. The displayed score is normalized so that 1 is ideal and 0 is worst. | Dimensionless score, 0–1 |
| Quality bands | Score intervals of width 0.1, such as 0.7–0.8. The vertical axis spans the lower edge of the lowest occupied band to the upper edge of the highest occupied band. | Dimensionless score |
| Cells | Number of volume cells in each quality band, shown by horizontal bar length. Each cell is counted once for the selected metric. | Integer count |
| Hover details | Quality range, number of cells in that range, and their share of the total mesh cell count. | Score, count, and percent (%) |
| Orange selection | The currently selected quality band and the corresponding isolated cells in the mesh view. | Display selection; no physical units |