Solution → Monitoring
Monitoring
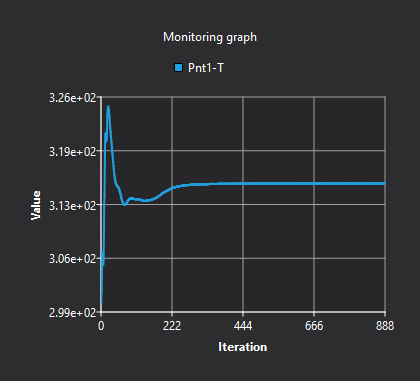
- The Monitoring graph displays selected variables at defined monitoring points or faces during the solution process.
Tips
- When Autoscale is disabled, you can manually zoom and pan the graphs with the mouse.

Computational Fluid x-Dynamics (CFxD)
Break the boundaries!