
Mesh → Quality graphs
Quality graphs
- Mesh quality is evaluated using orthogonality and skewness. Values close to 100% represent an ideal mesh.
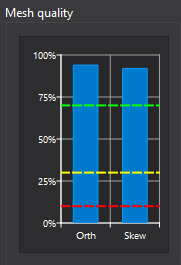
- The graphs include three quality thresholds: Green indicates high quality, yellow indicates satisfactory quality, and red indicates the minimum acceptable level.
Tips
- Values below the red threshold may be tolerated for complex geometries, but they can reduce solution accuracy and stability..